
Many of you have started reading this week. Thanks!
I like to construct narratives around my fantasy team, which currently operates under the name Goldschmidt’s Gold Shit. This was the dumb logo.
It’s a keeper league and I don’t think I’m gonna change it soon.
Behemoth slugger Paul Goldschmidt didn’t ascend to team leadership until early August, when he kicked Josh Reddick (and his Red Dick [SFW]) out of the clubhouse in a verbal altercation, his booming baritone resonating throughout the bowels of the stadium and every fan in it. You see, Reddick had been spending too much time at nighttime clubs, wielding his favorite toy and namesake, leaving himself depleted come gametime. Things all came to a head when Marco Scutaro screamed at Reddick in frustration, expressing incidentally some long-held and deep-seated ethno-linguistic tensions felt by pretty much everyone on the team, normally neglected in the daily performance of badass manhood. In other words, Scutaro was fucking fed up with the nickname “Scooter.” Long story short, Jose Iglesias was pushed into a table, paralyzed gruesomely, and released within minutes, while Scutaro turned his back on the team to follow the long cold path of revenge. In the end, it was Goldschmidt who stepped up to refocus the team, leading a bold charge up the rotisserie points standings all the way up to…third.
Anyway, I acquired Goldschmidt in late 2012 with a specific hunch suggesting a breakout for 2013. The hunch was that some of his doubles would turn into home runs, since I’ve heard a lot that power develops later than other skills. And Goldschmidt’s 2-to-1 ratio of doubles to home runs (43 to 20, to be exact) seemed abnormally high for a slugger of his caliber. So I figured he’d get two bumps in homers, one from growing into power and the other from a corresponding decrease in doubles. Even supposing Goldschmidt couldn’t age (as yet unconfirmed), I still would expect the doubles and home runs to average out.
Before 2012 it was reasonable to consider Kansas City DH Billy Butler a robot designed by some bored and impractical scientist to hit doubles with maximum efficiency in a believably human range. It was, I swear. Then he broke out for 29 dingers with only 32 doubles, evening out the ratio when previously it had been 2-to-1. The example of Butler, combined with the fulfilled promise of Goldschmidt this year, spurred me to study the league at large for a trend between doubles, home runs, and how power ages.
That study ballooned and ballooned as I struggled for find evidence for the hypothesis that home runs become a bigger share of extra base hits as hitters age. I didn’t always phrase the hypothesis that way, which was part of the problem. The answer of course was staring at me all along, but I’m glad I took myself on a wild goose chase, because I think I learned a lot of interesting things. See for yourself.
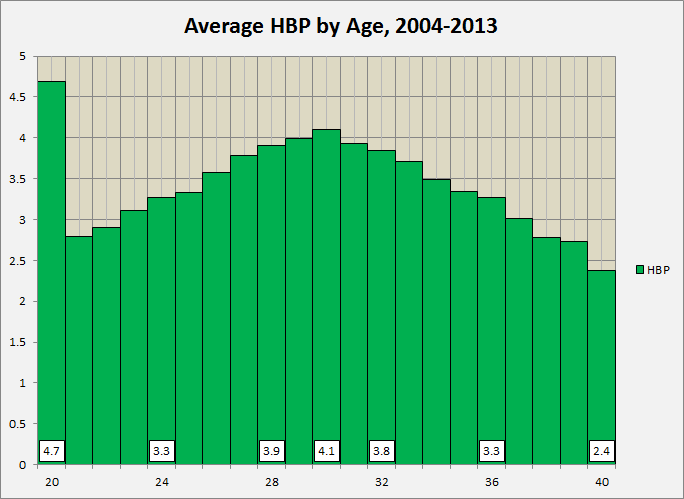
Wow! They can’t drink AND they get beaned disproportionately! I’m starting to pity all those 20-year-old ballplayers. Serious stuff starts below.
First I thought I should check the most consistent measures of power before getting caught up in the doubles search. So I got caught up in examining the year-to-year correlation of stats: HR, HR/PA, HR/Contact, HR/Air. “Contact” is shorthand for all plate appearances ending in contact. To get it I subtracted strikeouts, walks and HBPs from total plate appearances. “Air” is shorthand for all airborne batted balls. I used Fangraphs’ data to get fly balls and line drives. Might as well say all the data came from Fangraphs.
The pool of players I used started big and got bigger. I began by collecting all player-seasons from 2009 to 2013 with at least 100 PA, then filtered the pool so that only players who had 100 PA in consecutive seasons would be counted. Then I made a lot of what are in retrospect superfluous graphs that look like this example. I wasn’t satisfied, so I started over, doing the same thing for 2004-2013. I recorded all these R-squared figures to put into a summary bar graph.

It looks nice, I’ll give it that. The dark bars signify the 2004-2013 window, and the half-transparent bars 2009-2013. Over the long run, no combination of home runs plus other extra-base hits offered more predictive power than home runs alone. Isolated Slugging Percentage (ISO) was the next-best thing after home runs; though it comes just behind 2B+HR/Contact, a stat with a shamefully long name, ISO wins given how readily it can be found on the internet.
Within the subset of home run stats, HR/Contact was the most consistent year-to-year. My guess as to why would be that it isolates home runs from outcomes based on other batting skills. Walks and strikeouts are heavily influenced by a batter’s plate discipline, which is a separate skill (some say the sixth baseball tool) and itself an ever-evolving attribute. Thus HR/PA can be influenced by a sharp spike or drop of restraint at the plate in a way that HR/Contact is not. Whatever the underlying reason, HR/Contact ought to be of some use for projections. I for one will be using it for fantasy purposes.
I imagine the propensity to hit fly balls or ground balls stems from a batter’s swing mechanics, which are etched into a player’s muscle memory long before the major leagues. Such differences distinguish batters into types: the slap hitter, the slugger, the veteran bat-control guy, etc. Performance may wax and wane, but those kind of batting identities are ingrained. Plus, batted balls come in hundreds while home runs and doubles in tens; there’s simply more data. All these, reasons why Air/PA and Air/Contact are more consistent than the rest of the stats in that graph.
***

The bumps at 39 are Barry Bonds’ legacy. Dude broke a lot of calculators.
There are gains in the rates of walks and home runs, only they are tough to discern at this scale. I have other graphs where the differences are obvious, and I’ll make them public with all these graphs, even the ones that make no sense now that I think about it, on my Google Drive later this week.
Anyway, the decline in strikeouts is obvious, and lasts throughout a player’s thirties. Walks rise less dramatically, but never stop rising–at least until 40. Overall, strikeouts are reduced more than walks are increased, resulting in more plate appearances that end in contact as a player ages.

Moreover, there are basically no gains in HR/Contact with age. Mere tenths of a percent. Perhaps you wish to identify a plateau from ages 25 to 28 that is distinctly higher than a plateau from 21 to 24. The spike around thirty probably isn’t happenstance, given that my pool was 4394 player-seasons large. The spike at 39 is Barry Bonds again.
So far, I hadn’t found anything that convinced me of my theory behind home run surges. Could it really be the accumulation of all these little marginal differences? Is this the whole story: slighty fewer strikeouts, plus a few more walks, plus more plate appearances on average, plus small percentage points gained in home run rate, equals more home runs? It’s possible but I might have missed something, I thought. I couldn’t get the question off my mind, all thanks to Goldschmidt and Billy Butler. Tomorrow I’ll go into some of my later approaches.

Reblogged this on Wax Cracker and commented:
If you are a baseball stat and chart nerd like me you need to check out this blog!